


Urban functional evolution and sample generation
Urban expansion and land use evolution
From 2010 to 2015, the urban built-up area of Dalian increased year by year, with its proportion of the total area of Dalian also rising annually. In 2016, following the reorganization of Pulandian from a city to a district, there was a significant increase in the urban area, leading to a temporary decrease in the proportion of the built-up area. However, it continued to rise thereafter, indicating the continuous expansion of Dalian’s built-up area39. Concurrently, adjusting Dalian’s urban spatial structure facilitated changes in the infrastructure scope of different functional land uses. Between 2010 and 2021, the industrial land area expanded the fastest, increasing from 86.10 km² to 129.88 km², with its proportion rising by 8.11%. The area of residential land increased by 22.43 km², commercial land by 13.82 km², and although the area of transportation land increased year by year, its proportion fluctuated upward. Due to the optimization of land functions, the areas of public service land, logistics and storage land, public facilities land, and green spaces and squares decreased, with the reduction in green spaces and squares being the most significant, amounting to 19.91 km². By 2021, industrial and residential land accounted for the most significant proportions, at 29.33% and 32.09%, respectively, with the most notable change in the proportion of industrial land (Fig. 6).

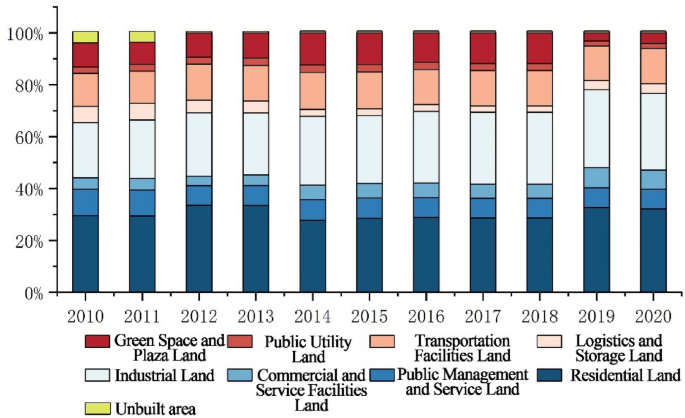
Dalian city land use area proportion map.
Urban functional area sampling generation
A map of single and mixed urban functional zones was generated. As shown in the Fig. 7 single-function areas are predominantly located on the periphery of the study area, such as the coastal regions in the northern and southeastern parts of the four districts, primarily characterized by extensive facilities like green spaces, tourist attractions, ports, and industry. Between the main urban area in the western region and the urban area of Lvshunkou, a green barrier formed by natural landscapes also exhibits characteristics of a single-function area. Mixed-function areas are mainly distributed in the city center, including the high-density developed central urban area and areas along the main traffic arteries, where the population is dense and production and living elements are concentrated. Since Dalian’s urban development follows the ecological model of “building the city around the mountains, with the mountains in the city,” field analysis of the research results revealed errors in the functional area identification of some green spaces and urban junction areas. This is mainly because the POI data lacks area information, which affects the identification of the land function, especially in small but numerous areas. Some blocks that were inadequately identified were manually adjusted to address this issue.

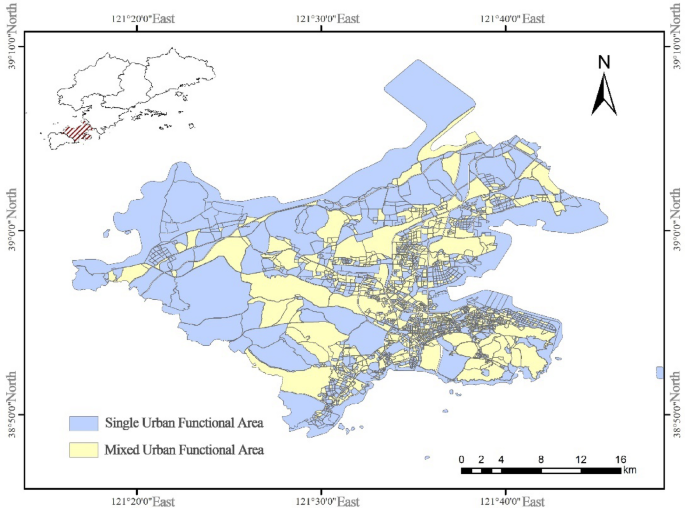
Map of single and mixed functional areas.
Segmentation of mixed-function neighborhoods is categorized into 18 urban functional areas (Fig. 8). By comparing the area and number of each functional area, they are simplified into single-function areas due to the small quantity and size of mixed-function areas. The simplification method involves recalculating the frequency density of various points of Interest (POI), selecting the function with the highest frequency density as the primary function of the neighborhood, and ultimately generating a distribution map of functional areas (Fig. 9). In the figures provided, the following abbreviations are used for clarity and brevity: Transportation Function (TF), Public Services (PS), Industrial Function (IF), Green Space and Plaza (GSP), Commercial Function (CF), Residential Function (RF), and Undeveloped Area (UA). The layout of neighborhood functions in the four districts of Dalian differs significantly: residential areas are distributed along roads, continuously in the central urban area, and sporadically in the periphery; commercial areas are concentrated in business districts such as Qingniwa Bridge and Xi’an Road, adjacent to residential areas; green spaces exhibit different distribution characteristics based on size: small urban green spaces are mainly city parks, located at street corners, residential areas, while large urban green spaces are near original ecological resources such as the Bohai Sea and mountains; industrial areas encircle the periphery of the city, continuous in the north and northeast; public service functional areas display an overall dispersed but locally clustered cluster-network structure; transportation areas are scattered in the central area and coastal areas, mainly centered around stations, airports, and ports.

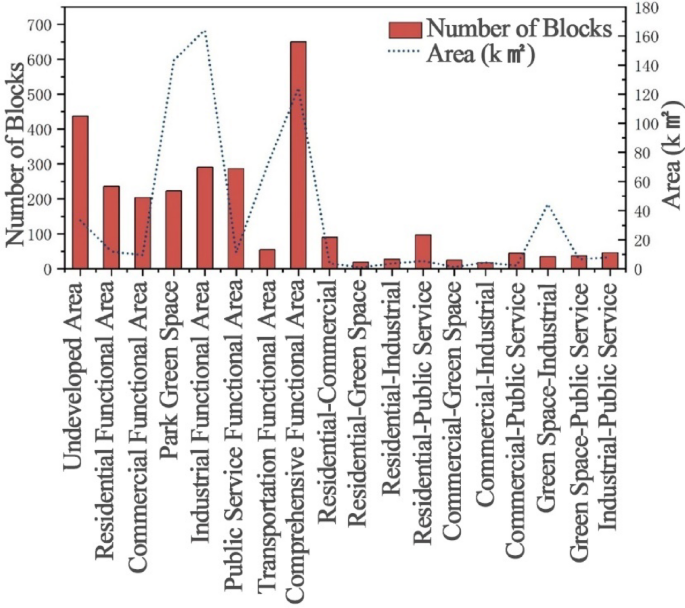
Statistics on the number of functional blocks.

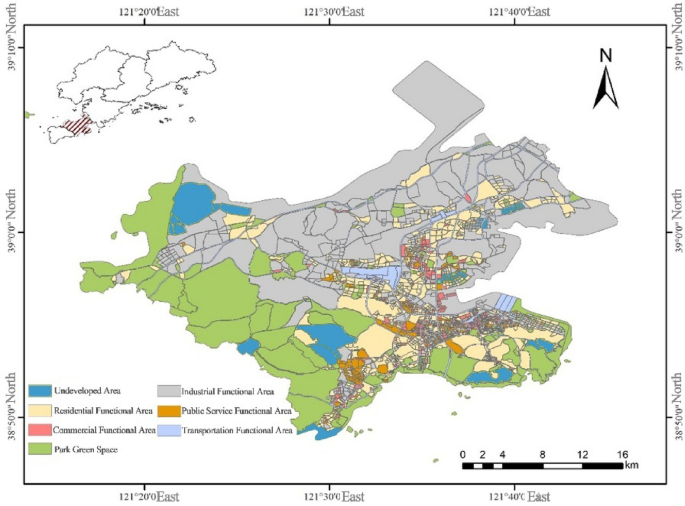
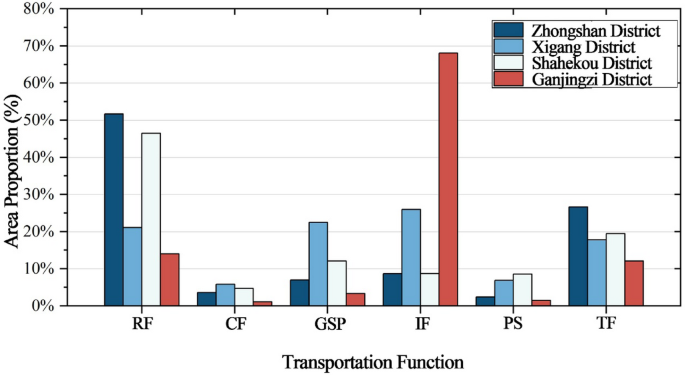
Examining the functional distribution (Fig. 10): Zhongshan District is the old urban area of Dalian, with concentrated residential and transportation functions, accounting for 51.7% and 26.6%, respectively. Xigang District, with a smaller area, exhibits an even distribution of functional areas, with the lowest proportions of commercial and public service functions at 5.8% and 6.9%, respectively. Shahekou District has the highest population density40, with residential functions accounting for 46.6%, and other functional areas are more minor, with none exceeding 20%. Ganjingzi District boasts developed transportation facilities, including two major airports and multiple ports, with industrial functions accounting for 68.0%, residential areas 14.0%, and transportation areas 12.1%. The distribution of each functional area aligns with urban planning.

Area share of functional areas in main urban area of Dalian.
Characteristics of light environment distribution at the administrative district scale

Map of night-time lighting parameters in the administrative district: (a) \(\:{L}_{sum}\), (b) \(\:{L}_{avr}\), (c) \(\:BF\).
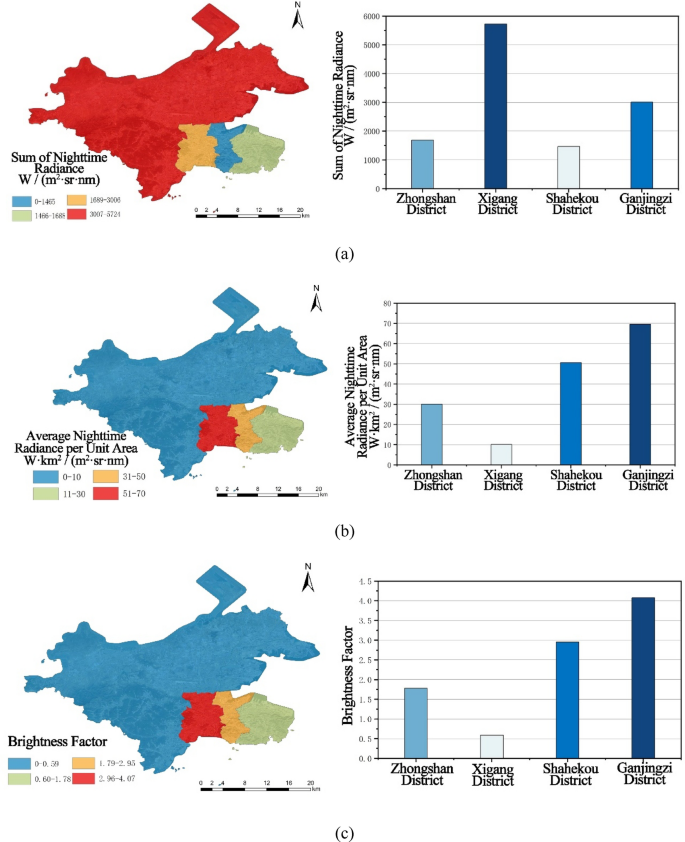
Based on nighttime remote sensing imagery, a statistical analysis of nighttime light brightness was conducted, calculating \(\:{L}_{sum}\), \(\:{L}_{avr}\), and \(\:BF\). The spatial distribution and numerical statistics of the nighttime light environment were obtained (Fig. 11). In terms of the total value of nighttime light radiation brightness (Fig. 11(a)), Ganjingzi District ranks first with 5724.55 W/(m2·sr·nm), benefiting from its large regional and built-up area. In contrast, Xigang District has the lowest contribution rate, accounting for only 12% of the total area. Looking at the nighttime light radiation brightness per unit area (Fig. 11(b)), Shahekou District leads with 69.65 W/(m2·sr·nm), reflecting its densely populated and smaller area, followed closely by Xigang and Zhongshan Districts with 50.58 W/(m2·sr·nm) and 30.05 W/(m2·sr·nm) respectively. Ganjingzi District, due to its vast area, has the lowest value. Regarding the nighttime light brightness factor (Fig. 11(c)), Shahekou District shows an over-bright area with a high value of 4.07, while Ganjingzi District has only 0.59, demonstrating the impact of area size on brightness distribution.
Characteristics of light environment distribution at the street scale
Based on the scope of the study, the research area was divided into 33 street space units according to the criteria of major roads41, secondary roads, and principal blocks, to facilitate the analysis of spatial light environment distribution at a medium scale. To fully represent the spatial extent, areal data were used to study the light distribution at the street scale. Based on nighttime remote sensing imagery, a statistical analysis of nighttime light brightness was conducted for 33 streets, obtaining the spatial distribution of the nighttime light environment for each street block (Fig. 12) and the numerical statistical chart (Fig. 13).
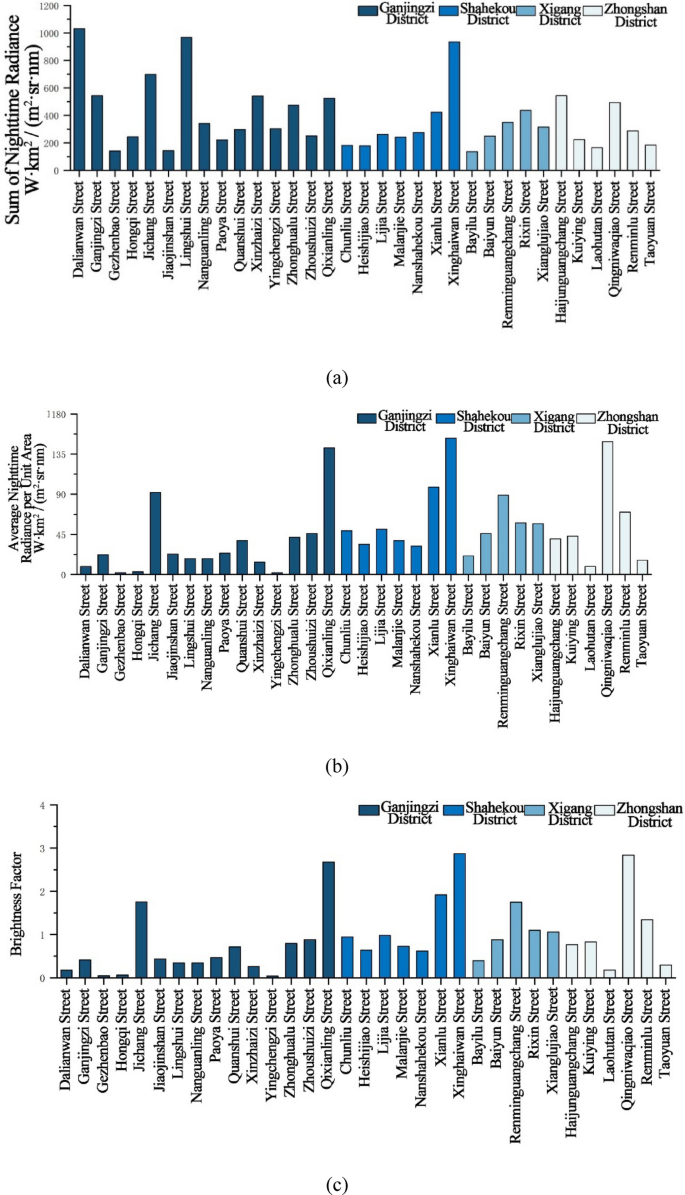
Through the analysis of nighttime light radiation brightness, it was found that the streets of Dalian Bay, Lingshui, Xinghai Bay, and Airport have the highest total brightness, accounting for 28.8% of the study area, and making a significant contribution to the nighttime brightness of the main urban area. Xinghai Bay is in Shahekou District, while the other three streets belong to Ganjingzi District. The streets with the lowest total brightness include Bayi Road, Getingpu, Jiaoshan, and Laohutan. The brightness per unit area analysis shows that the streets of Xinghai Bay, Qingniwa Bridge, Qixianling, and Xi’an Road have the highest brightness, concentrated in the urban core area. In contrast, peripheral areas such as Getingpu, Yingchengzi, and Hongqi streets have lower brightness. The streets with the highest and lowest brightness factors correspond to the brightness per unit area distribution results.

Distribution of the total value of luminous radiation in 33 streets: (a) \(\:{L}_{sum}\), (b) \(\:{L}_{avr}\), (c) \(\:BF\).

Statistical chart of nighttime luminous radiation values in 33 Streets: (a) \(\:{L}_{sum}\), (b) \(\:{L}_{avr}\), (c) \(\:BF\).
Characteristics of light environment distribution in different functional areas at the block scale
Similarly, based on nighttime remote sensing imagery, the nighttime light brightness of 2,282 urban functional zone units within the selected area was statistically analyzed, and relevant charts and graphs were generated.
Sum of nighttime radiance (\(\:{L}_{sum}\))
The analysis of \(\:{L}_{sum}\) (Fig. 14) shows that high-brightness areas are concentrated in the southeastern part of the main urban area, and the values are directly proportional to the area. The six urban functional areas are ranked as follows: Residential Function > Industrial Function > Transportation Function > Green Spaces and Plaza > Public Service > Commercial Function.

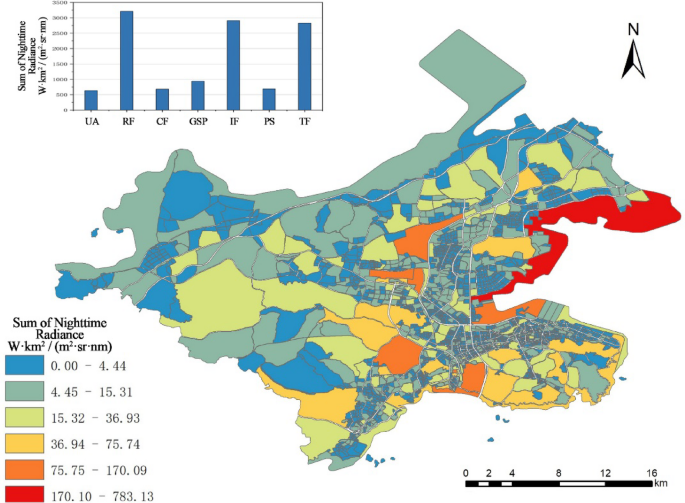
Statistics and spatial distribution of the \(\:{L}_{sum}\) of functional blocks.
The analysis of the nighttime light brightness values in the four administrative districts of main urban area of Dalian (Fig. 15) shows that in Ganjingzi District, the industrial areas have the highest total brightness value, accounting for 37.16%, while the total value for urban green spaces is the lowest. In Shahekou District, the residential areas have the highest total brightness value, accounting for 29.3%, with the commercial functional areas having the lowest total value. The transportation functional areas in Xigang District and Zhongshan District have the highest total brightness values.

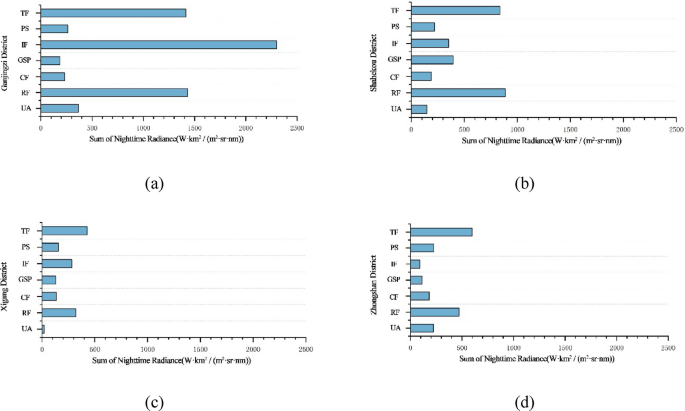
Statistics on the \(\:{L}_{sum}\) of functional blocks: (a) Ganjingzi District, (b) Shahekou District, (c) Xigang District, (d) Zhongshan District.
Average nighttime radiance per unit area (\(\:{L}_{avr}\))
Analysis of the \(\:{L}_{avr}\) in the four districts (Fig. 16): The values are high in the central area and decrease outward. The six urban functional areas are ranked as follows: Commercial Function > Public Service > Transportation Function > Residential Function > Green Spaces and Plaza > Industrial Function.

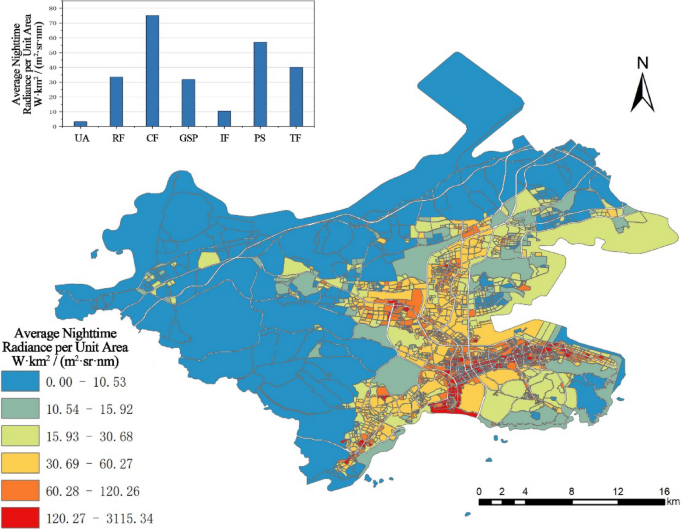
Statistics and spatial distribution of \(\:{L}_{avr}\) of functional blocks.
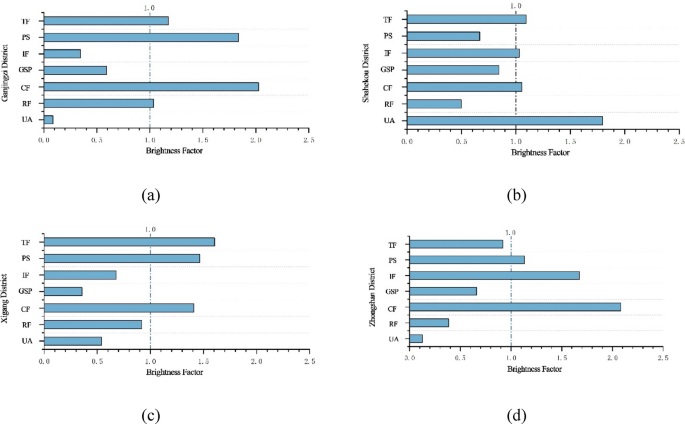
A Comparative analysis of the \(\:{L}_{avr}\) among the four administrative districts of Dalian’s main urban area (Fig. 17) shows that in Ganjingzi District, the commercial areas have the highest \(\:{L}_{avr}\), which is twice the \(\:{L}_{avr}\) of the entire administrative district, while the undeveloped areas have the lowest. In Shahekou District, the transportation areas have the highest \(\:{L}_{avr}\), and the residential areas have the lowest. In Xigang and Zhongshan Districts, the commercial areas have the highest \(\:{L}_{avr}\), with the lowest being urban green spaces and undeveloped areas, respectively.

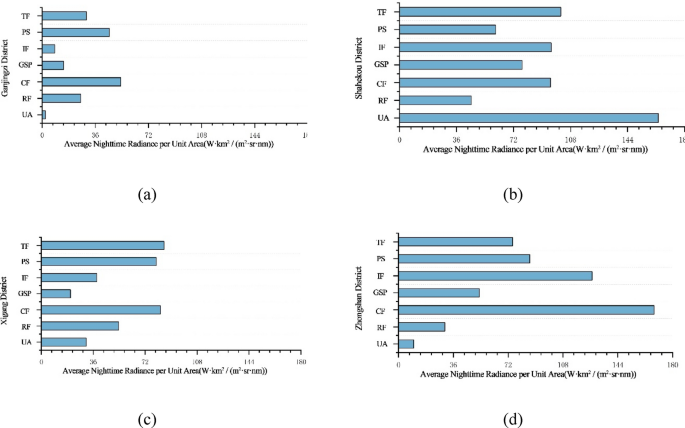
Statistics on the \(\:{L}_{avr}\) of functional blocks: (a) Ganjingzi District, (b) Shahekou District, (c) Xigang District, (d) Zhongshan District.
Brightness factor (BF)
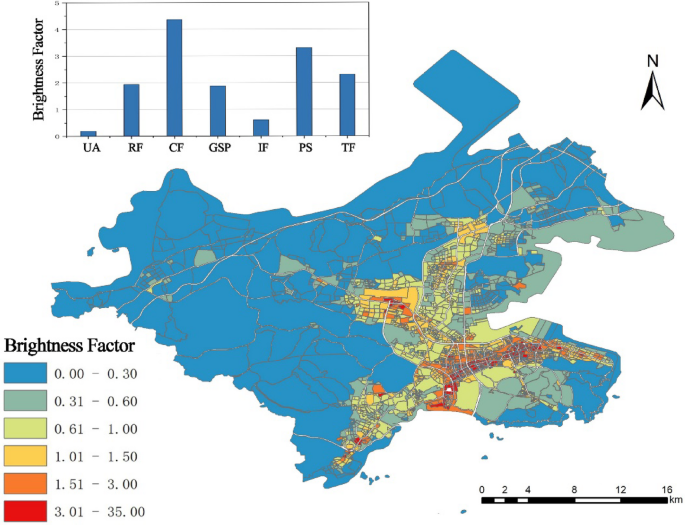
Analysis of the \(\:BF\) in the four districts of main urban area of Dalian (Fig. 18) shows that the high-value \(\:BF\) areas are concentrated in commercial areas and Xinghai Square, which is highly consistent with the \(\:{L}_{avr}\), while low-value areas are located on the outskirts of the city. The \(\:BF\) ranking for the six functional areas is as follows: Commercial Function (4.59) > Transportation Function (2.55) > Public Service (2.46) > Residential Function (1.75) > Green Spaces and Plaza (1.63) > Industrial Function (0.62). The ranking and proportion (Fig. 19) are similar to those in Sect. 4.3.2.
Statistics and spatial distribution of \(\:BF\) of functional blocks.

Statistics on the \(\:BF\) of functional blocks: (a) Ganjingzi District, (b) Shahekou District, (c) Xigang District, (d) Zhongshan District.
Suitability evaluation of brightness in different functional areas
Suitability evaluation based on brightness factor
The \(\:BF\) is derived by dividing the average radiance of each functional category area by the average radiance of the entire study area, allowing for a comparison of the relative brightness of artificial light emitted by different functional areas. The scatter plot of the \(\:BF\) for 2,620 functional blocks (excluding undeveloped areas) (see Fig. 20) uses a \(\:BF\) of 1 as the overall standard for evaluating the brightness of urban nighttime lighting. There are 865 blocks with a \(\:BF\) greater than 1, accounting for 33.0% but covering only 5.2% of the area. The maximum \(\:BF\) values for the six functional areas are Residential Areas 7.8, Commercial Areas 7.9, Urban Green Spaces 8.6, Industrial Areas 8.1, Public Service Areas 8.8, and Transportation Areas 3.1. There are 1,755 blocks with a \(\:BF\) less than 1, accounting for 67.0%, with an area proportion of about 94.8%, showing a dense numerical distribution, while those with a value greater than 1 are more dispersed.

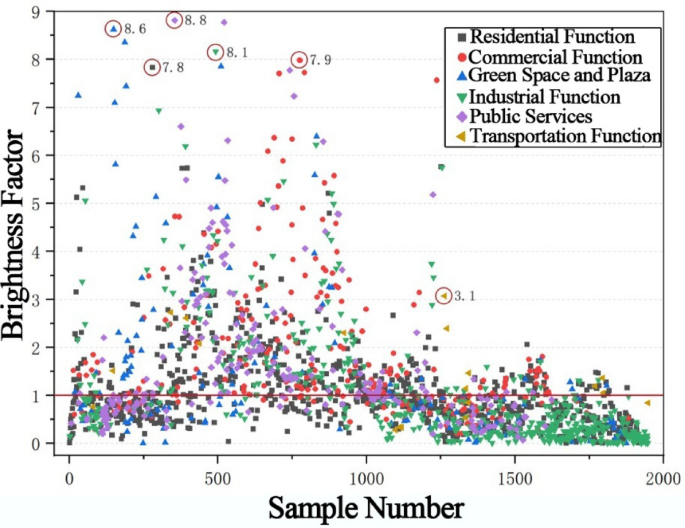
Scatterplot of \(\:BF\) for functional blocks.
Spatial distribution of over-bright and under-bright blocks in different functional areas
A scatter plot is made for the \(\:BF\) of each functional area (excluding blocks with a \(\:BF\) of 0). In this section, a \(\:BF\) of 1 is considered the benchmark for the brightness of urban nighttime lighting, and the \(\:BF\) values in Sect. 4.3.3 for each functional area are used as the concentrated distribution values to determine the clustering interval (Fig. 21). There are 1,029 residential blocks with an overall lower \(\:BF\), concentrated between 0 and 1.75, with 110 blocks exceeding 1.75 that are sparsely distributed and cover an area of only 3.56%. The commercial area has 363 blocks, concentrated between 1 and 4.59, with only 19 blocks exceeding 4.59, covering an area of 3.06%. Urban green spaces have 195 blocks, with blocks exceeding 1.63 covering an area of 3.77%. The industrial area has 563 blocks, concentrated between 0 and 1, with 150 blocks exceeding 1, covering an area of only 2%. The public service area has 313 blocks with a more dispersed brightness factor, with 46 blocks exceeding 2.46, covering an area of 6.5%. The transportation functional area has 25 blocks with significant variation in brightness factor values, with very few exceeding 2.55; 13 blocks have a value less than 1, accounting for 4.1% of the total area of the transportation functional area.
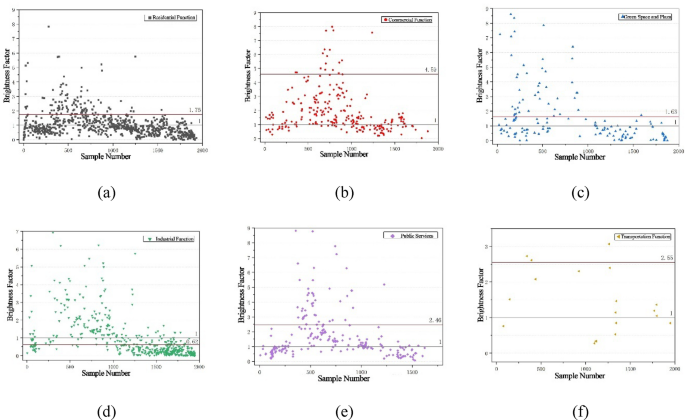
Scatter plot of \(\:BF\) for individual functional areas: (a) Residential Function, (b) Commercial Function, (c) Green Space and Plaza, (d) Industrial Function, (e) Public Services, (f) Transportation Function.
The scatter plot shows that most blocks have moderate nighttime light brightness, but some functional areas exhibit uneven brightness, with some areas being locally over-bright or under-bright. The ranking of \(\:BF\) for urban functional areas is Commercial Function > Transportation Function > Public Service > Residential Function > Green Spaces and Plaza > Industrial Function. The commercial and transportation areas, with the highest \(\:BF\) and the park green spaces and industrial areas with the lowest are selected for analysis, using the clustering interval as the standard, with areas above the interval considered over-bright and those below considered under-bright. Park green spaces and undeveloped areas have lower brightness, adhering to the “Dark Sky Protection Principle,” so the focus is on over-bright areas. The industrial functional area is adjacent to the residential area, and over-bright lighting may disturb residents’ lives, so only over-bright areas are analyzed.
Figure 22 shows that the over-bright commercial areas are concentrated in the city center, such as Dalian New Mart, Friendship Shopping Center, and Dalian Financial Building; under-bright commercial areas are mainly on the urban fringe, represented by Xianglu Jiao and Jin San Jiao Market, and some residential areas with supporting commercial facilities also experience this issue. The over-bright areas of the transportation functional area are mainly the parking lots outside the airport and bus stations, while under-bright areas are located in Dalian Port and its coastal areas. In urban green spaces, areas such as Xinghai Square are over-bright due to amusement facilities; large parks in the city center, such as People’s Square Park and Children’s Park, also exhibit over-bright phenomena. In the industrial area, over-bright areas are concentrated along the roads in the city center, such as around the airport and port. Donggang, as a comprehensive business district with diverse functions, classifies company and enterprise POIs as industrial functional areas, leading to continuous over-bright occurrences in this area.

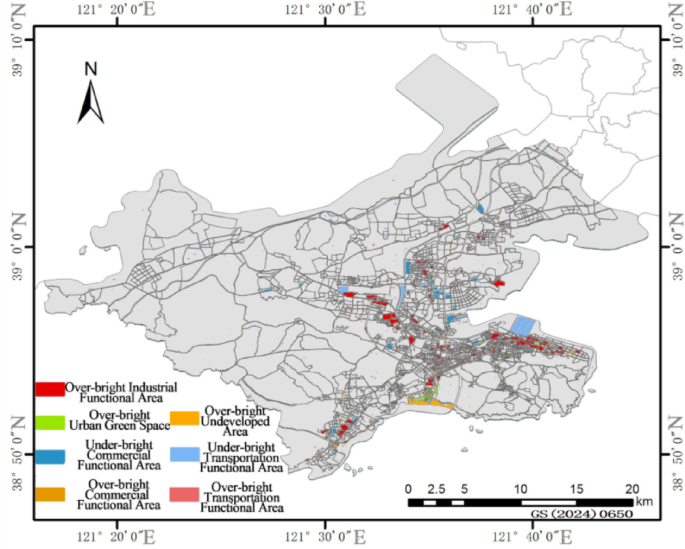
Spatial distribution of over-bright and under-bright neighborhoods.
link